Independent Project · 2026
CRM & Lead Management Dashboard
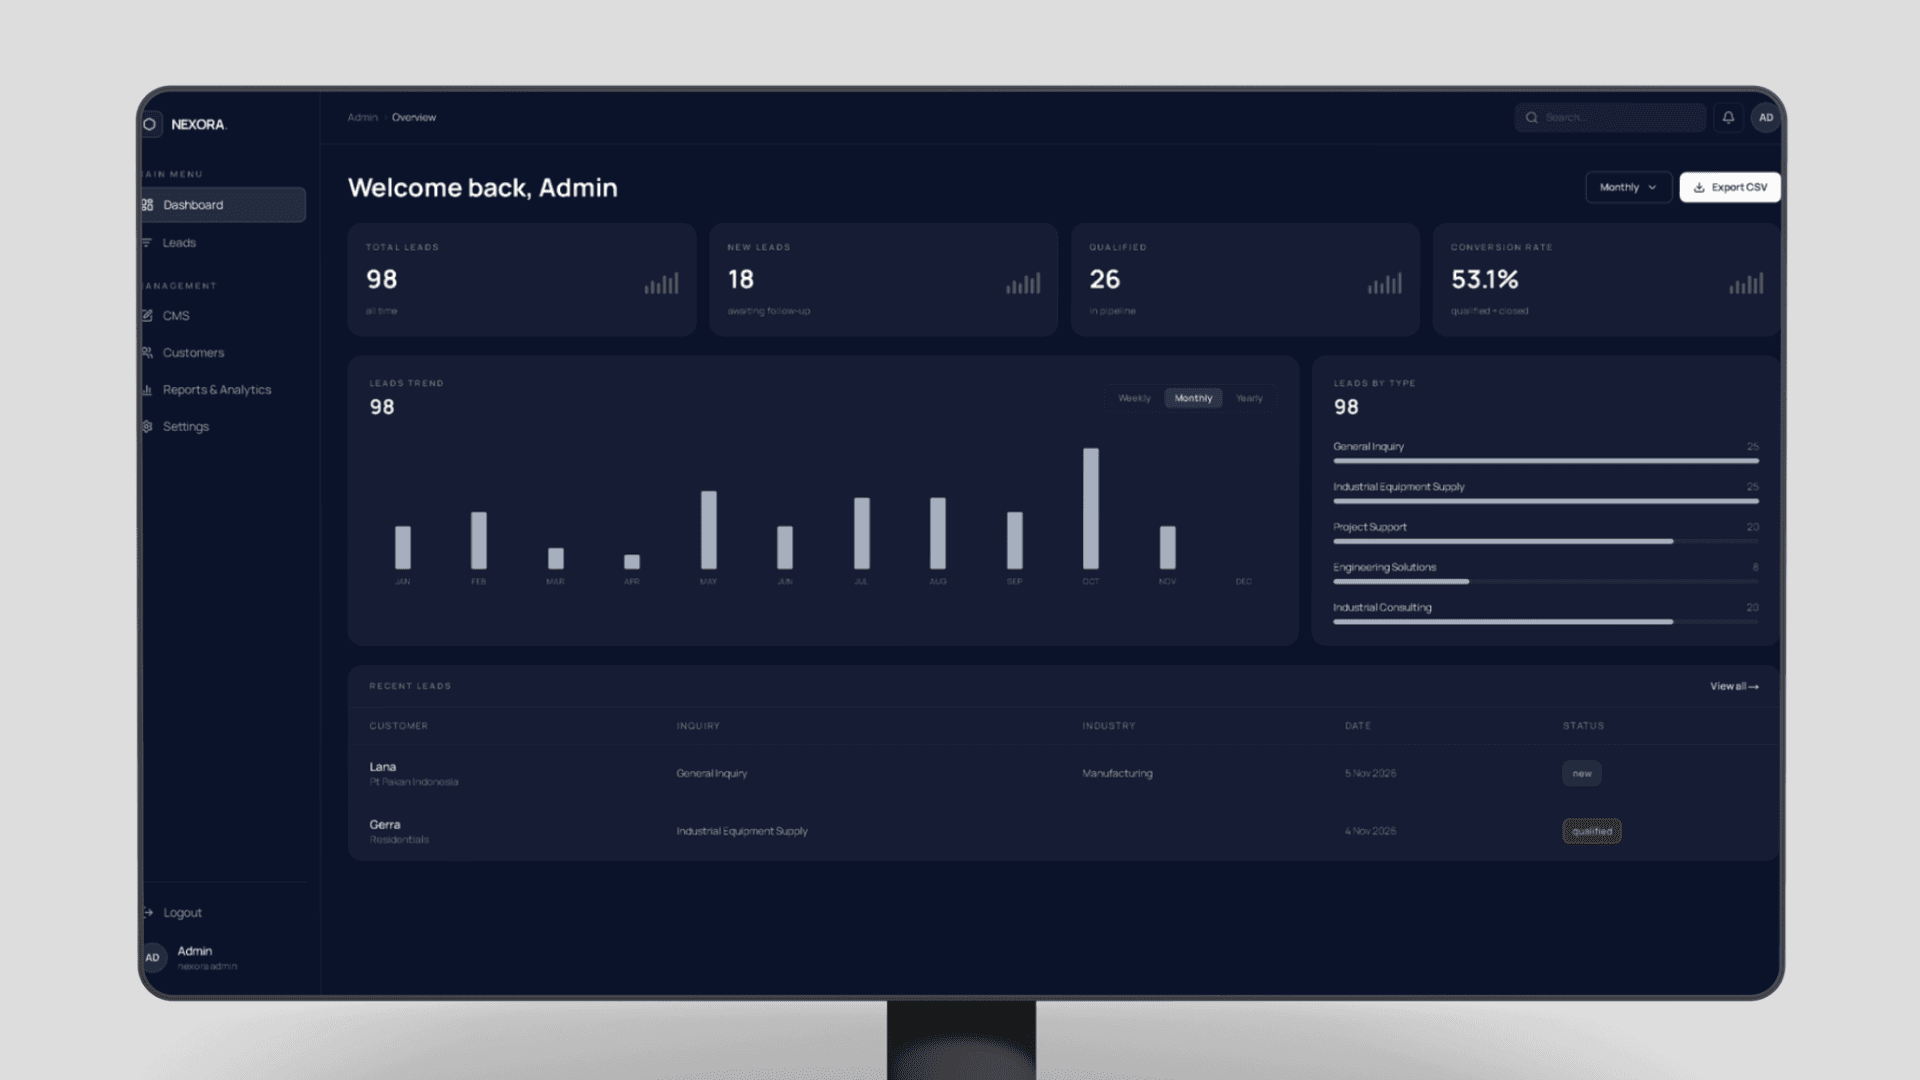
Internal dashboard for capturing, qualifying, and following up sales leads — pipeline views, customer records, and exportable reports.
On this page
Project Overview
- Project type
- Independent Project
- Year
- 2026
- Role
- Design & build — solo
- Status
- Live demo
- Stack
- Next.js · TypeScript · Tailwind CSS · Recharts · Vercel
The Problem
For businesses that get inquiries through WhatsApp, forms, and referrals, leads pile up without structure — nobody knows which inquiries are new, which are qualified, or which were never followed up.
This project explores a CRM dashboard pattern for that workflow: one place to see lead volume, pipeline status, and the follow-up queue.
My Responsibilities
- Dashboard information architecture — what an operator needs to see first
- Lead pipeline model: new → qualified → closed
- Reports and analytics views with period filters
- CSV export for reporting outside the app
- Responsive layout for desktop and mobile use
Core Workflows
01
Lead intake
New inquiries land in a leads list with source, type, and date — the queue an operator works through.
02
Qualification
Each lead moves through statuses (new, qualified, closed), keeping the pipeline visible instead of buried in chat history.
03
Reporting
Leads-by-type and trend views show where inquiries come from; the report can be exported to CSV.
System Architecture
Frontend
- Next.js App Router with a dark, dense dashboard UI
- Chart components for trends, status breakdowns, and lead types
Backend & data
- Typed lead records with status transitions
- Aggregation for dashboard metrics and period filtering
Deployment
- Deployed on Vercel as a live demo
Key Engineering Decisions
Metrics on top, queue below
The overview leads with counts and conversion rate, then shows the recent-leads table — matching how an operator actually scans the screen.
Exportable by default
Reporting isn't locked inside the app — one-click CSV export keeps the data usable in the tools a business already has.
Challenges & Solutions
Challenge
Presenting dense data — metrics, charts, and a leads table — without a cluttered screen.
Solution
Grouped the dashboard into a clear visual hierarchy: headline metrics, trend charts, then the working table.
Validation & Testing
- Checked all dashboard states against demo data — empty, filtered, and populated views
- Verified responsive behavior on desktop and mobile breakpoints
Outcome & Current Status
The demo is live at nexora.aprpresence.com and demonstrates the full dashboard pattern: pipeline metrics, lead queue, and exportable reports.
It serves as a working reference for CRM-style internal tools.
What I Would Improve
- Real data source — connect form submissions and WhatsApp inquiries directly
- Per-user assignment so follow-ups have an owner
- Activity log per lead — notes, calls, and status history
Explore the project
Next project
Inventory Management System